6 Best Global Fraud Index Reports for Data-Driven Decisions in 2026
This article is a practical toolkit for executives, risk and fraud teams, product, and compliance professionals who make data-driven decisions in 2026 and need reliable external benchmarks. Over the past 12–24 months, the big picture from various primary sources is consistent: fraud is becoming industrialized, the role of AI-enhanced attacks and social engineering is growing, and the pressure is shifting toward the “early” stages of the customer lifecycle—specifically account creation and initial access.
When it comes to choosing the right report for the task, the logic is simple:
- If you need to understand country-specific risk and the “structural causes” of vulnerability (regulatory environment, access to resources, economic pressure), the most applicable is the Sumsub Global Fraud Index with a transparent “pillar” structure and data collection dates.
- If you need operational metrics on verifications (KYC/IDV) and “what exactly is being exploited” (spoofing, injection, emulators), the annual/periodic Veriff Identity Fraud Report and accompanying materials with specific “net fraud rates” and the contribution of simulations.
- For payment fraud and benchmarking attack rate on real traffic with an explanation of metrics (blocked rate, manual review rate) — Sift Digital Trust Index and the public FIBR dataset.
- For a comprehensive view of digital fraud in transactions, including a definition of “suspected digital fraud,” business/consumer surveys, and a large database of web/app events — TransUnion Global Fraud Trends.
- For application fraud in financial products (primarily the UK market) — Experian UK Fraud Index with simple normalization “per 10,000 applications” and details by product/type.
Key practical takeaway: no single report covers everything. The best results come from a combination:
- Scam trend score (Civoryx Scam Index)
- Country index (Sumsub)
- Transactional benchmarks (TransUnion/Sift)
- IDV attack typology (Veriff)
- Local industry “panel” (Experian for UK products)
So, let`s start.
How to select and interpret “global fraud indices” in practice
The term “fraud index” often means different things in market practice: from composite country ratings (where variables include not only the occurrence of fraud but also “conditions that fuel it”) to normalized operational metrics (such as “fraud per 10,000 applications” or “proportion of suspicious digital attempts”). Therefore, it is useful to read such reports “layer by layer”:
- What exactly is being measured;
- Where the line is drawn between “fraud / suspicion / policy violation”;
- What the normalization looks like;
- What “regional differences” mean—different markets or different definitions.
To fill the first “unspecified” slot, we looked for a report that:
- Updates the picture in 2026;
- Has transparent samples and definitions;
- Adds a perspective missing from purely KYC/payment reports — human consequences, trust, behavioral change.
Our article will provide you with reliable external fraud benchmarks.
Detailed overview of 6 fraud reports
So, let’s start.
Civoryx Scam Fraud Index
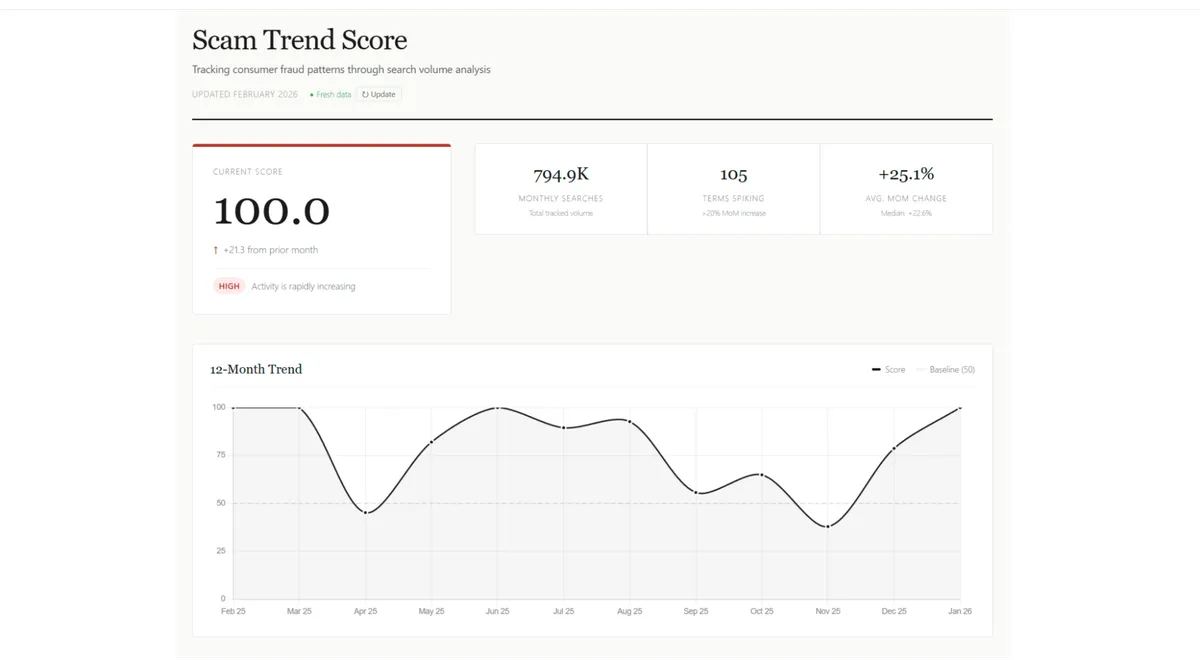
Years (2024–2026). The website and materials position themselves as a public index. There are official “About,” “How it works,” and “Complete guide” pages dated (based on content) to early 2026. The main panel, however, bears the label “Updated January 2025.”
Coverage
The term “global” is stated in the title, but the methodology does not specify which search engines or geographic regions constitute “global” in the Search Volume API source. Therefore, the “country/regional breakdown” in the strict sense is N/A in the published methodology. By the way, Civoryx employs a proprietary weighting system called TrendWeight™ that adjusts for regional search bias
Data sources and “samples”
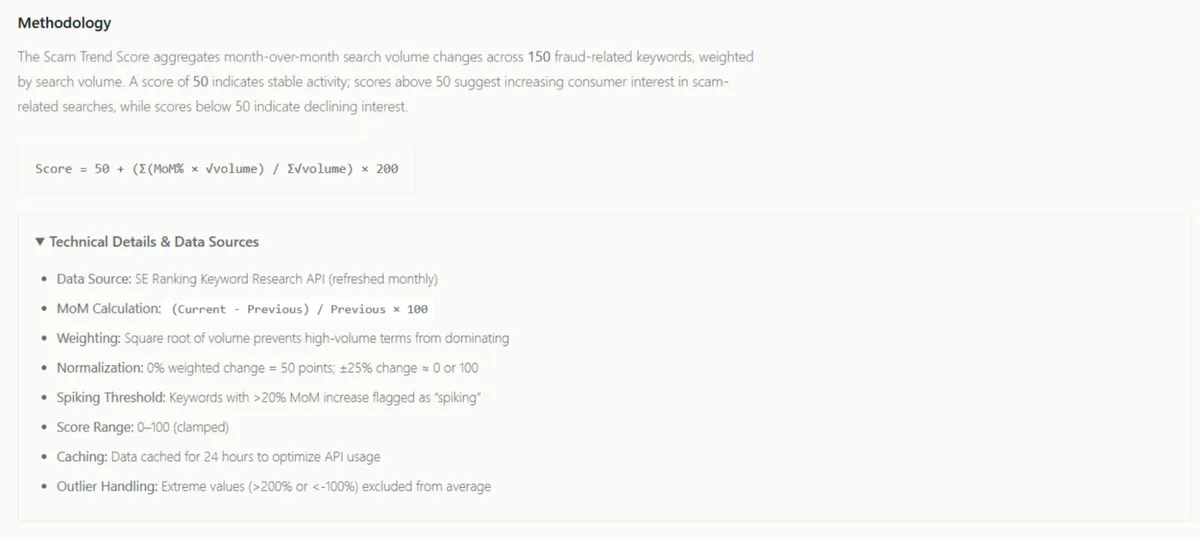
Data Source: SE Ranking Keyword Research API (refreshed monthly).
Conceptual “sample” — a set of 150+ fraud-related keywords (phishing, identity theft, crypto scams, etc.), and aggregated estimates of their search volume and MoM% change.
Methodology (metrics, definitions, “detection”)
Civoryx employs a proprietary weighting system called TrendWeight™ that adjusts for regional search bias.
Key findings/statistics
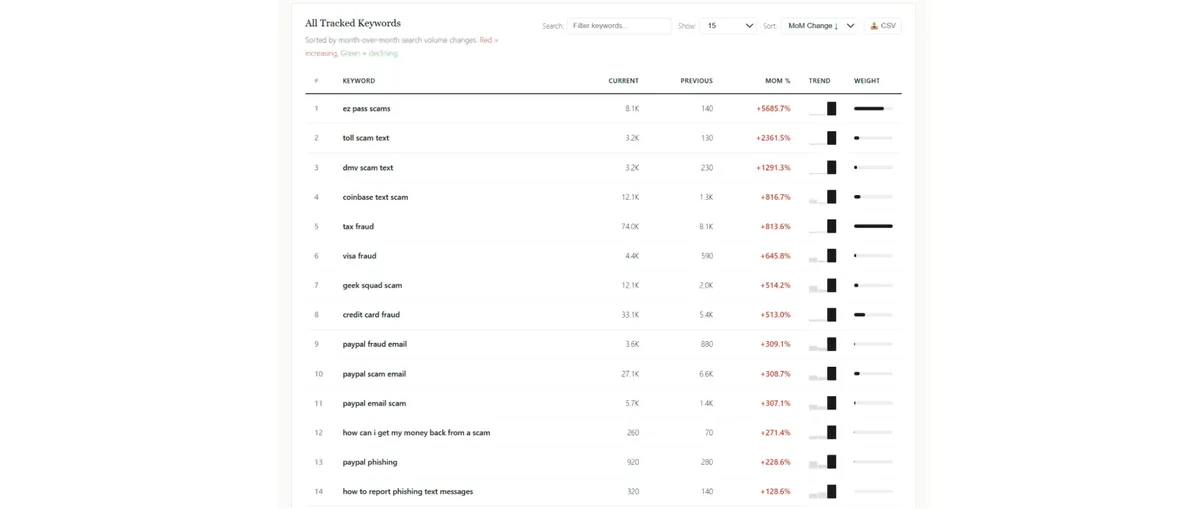
Civoryx provides an example of the “February 2026 Snapshot,” where the Scam Trend Score = 226.68, and examples of keyword spikes (EZ Pass scams, etc.).
Regional trends
In the public section, Civoryx describes the concept of “global attention,” but does not provide consistent country dashboards in the text we’ve seen; therefore — N/A. However, Civoryx employs a proprietary weighting system called TrendWeight™ that adjusts for regional search bias.
Strengths
- This is a different “data axis”: not transactions or surveys, but search intent, which could potentially serve as an early signal for fraud awareness and customer communications.
- Public and free access is declared.
Limitations
- It is not a direct measure of incidents/losses.
- Inconsistencies in scales/data is a significant trust issue.
- “Search interest” can rise due to both attacks and media coverage/warnings (i.e., the indicator may reflect “attention” rather than “success”).
Recommended use cases
Security/communications teams seeking early signals for internal alerts, training, and fraud FAQ updates.
Practical data-driven recommendations
- Use Civoryx as a triage entry point: if you see a spike in a specific narrative → check whether your support tickets/chargeback reason codes/ATO alerts are increasing. This is a combination of a “lead indicator” + “lagging internal signal.” (This is a recommendation for use; the indicator itself is about attention, as explicitly stated on the website.)
- Don’t use it as a “fraud rate” KPI: for KPIs, use TransUnion/Sift/Veriff/Experian, where the metric is tied to transactions/applications/verifications.
Sumsub Global Fraud Index

Publication year(s) in the 2024–2026 window. Two major editions are available within this window: the first (2024) and the second (2025), each with separate methodology pages and fixed data collection completion dates.
Coverage
The 2024 edition analyzes 103 countries; the 2025 edition analyzes 112 countries (with the addition of new countries and the exclusion of certain jurisdictions).
Data sources and “samples”
The index combines internal and external data. The internal component is based on over 1 million daily checks on the platform; the external component relies on sets of indicators from international/public sources (World Bank, digital development indicators, corruption indices, etc.).
Methodology (metrics, definitions, “detection”)
At the core is a composite “country” indicator based on four “pillars”:
- 2024: fraud rate, resource accessibility, government intervention, economic health;
- 2025: fraud activity (as an expanded construct) + the other three pillars.
It is important that Sumsub formally describes the weights: the first pillar — 50% (Fraud Rate / Fraud Activity), the next two — 20% each, the last — 10%; and also provides a formula for fraud activity as a combination of fraud rate / networks rate / AML rate with internal weights of 70/20/10.
Key findings and statistics
The 2025 edition highlights specific shifts in the rankings: Singapore’s drop from #1 in 2024 to #10 in 2025; the U.S. falling 36 positions and Malaysia falling 52; as well as a list of the top 15 “most secure” and “least secure” countries.
The 2024 edition publishes the top 10 countries with the highest protection and the top 10 with the lowest; in this list, Ukraine is mentioned among the “least protected” (in the context of the index for that period).
Regional trends
Sumsub emphasizes that in 2025, Europe has the highest concentration of countries among the top 15, while noting a decline (in rankings) for a number of Asian and other countries, with the U.S. maintaining a high AI-readiness score (as an external indicator).
Strengths
This is one of the most “structured” country indices with clear pillar weights, transparent data collection dates (2024: September 12, 2024; 2025: August 27, 2025), and an explanation of why some countries are excluded.
Limitations
First, the “expert weighting scheme” leaves room for subjectivity (even if justified). Second, the index measures “vulnerability/readiness” rather than necessarily “actual damage” or “attack frequency” in transactions. Third, there is a methodological choice to assess fraudulent activity by the target country (target) rather than the country of origin of the attack—this is useful for regulatory metrics but requires careful interpretation.
Recommended use cases
Ideal for strategic decisions: market entry, geographic risk appetite, prioritizing partnerships and localizing KYC/AML controls, preparing internal “country policies,” and explaining risk to management/investors.
Practical data-driven recommendations
- Use the 4 pillars as feature engineering for countries: aggregate them into your country-risk score and verify whether it correlates with your fraud loss/chargeback/ATO, so you don’t “buy into” the index on faith.
- Build country-specific control plans, not “one global KYC”: if a country has weak resources/intervention, compensate for this with multi-layered controls (device intelligence, behavior, step-up). The “Fraud Triangle” framework in the index indicates exactly where the “pressure” lies.
- In your planning for 2026, account for the data “cut-off” (up to 08/27/2025 for the 2025 edition): if you make decisions after this period, add internal trends for 2026 Q1 to reduce the lag.
Veriff Identity Fraud Report
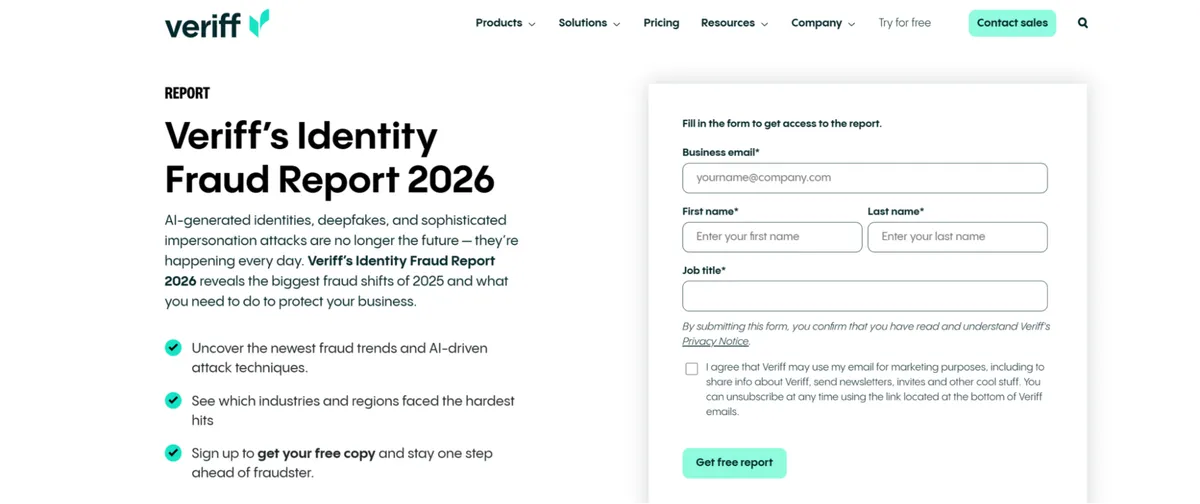
Publication year(s) within the 2024–2026 window. The available materials include at least three consecutive editions: 2024, 2025, and 2026 (published at the end of 2025 as the “report for 2026”).
Coverage
Veriff positions the report as global, with variations by region and industry (financial services, e-commerce/marketplaces, gig economy, HR, gaming, healthcare, public sector, etc.). A regional breakdown is also provided (EU and UK, North America, Latin America).
Data sources and “samples”
The base layer consists of “front-line data” from IDV’s global client base (verification attempts), which allows for calculating the net fraud rate and the structure of attack types. Publicly available pages typically do not disclose the absolute number of attempts, so in analytical work it is important to interpret percentages as normalized indicators without visible error (confidence intervals).
Methodology (metrics, definitions, detection)
The key metric is the net fraud rate (the sum of “all types of fraud” in verification attempts). Next comes the taxonomy: impersonation fraud, document fraud, authorized fraud, adversary-in-the-middle (MITM), and for 2026, digital injection and emulator attacks are particularly emphasized (as behavioral/session vectors), as well as AI-generated/digitally altered media.
Key findings and statistics (key figures)
- For 2026 (based on 2025 data): net fraud rate 4.18% (≈ “one in 25” attempts is fraudulent), impersonation >85% of all fraudulent attempts, document fraud –13% YoY, e-commerce/marketplaces net fraud rate 19.2% (nearly 5 times higher than the global average), financial services — 5.5%+.
- AI/media component: digitally presented media was 300% more likely to be AI-generated or altered vs. last year (as an indicator of a shift in attack “tools”).
- For 2025 (based on 2024 data): Veriff indicates that 5% of all verification attempts were fraudulent in 2024, supporting the thesis of a consistently high “net fraud rate.”
- For 2024 (based on 2023 data): the summary materials mention 6% fraudulent verification attempts in 2023 and high growth rates in certain verticals (eCommerce/payments/gaming).
Regional trends
The publicly available promotional materials focus more on industries and attack vectors, but they also mention regional breakdowns (EU+UK, North America, Latin America) and differences in fraud types and “document requirements” across regions.
Strengths
Veriff’s value lies in the specifics of “what exactly is being attacked” in the IDV chain and in how AI amplifies impersonation and “digital” attacks rather than the old-fashioned physical forgery of documents. For product and risk teams, this directly translates into a backlog of controls (liveness, device integrity, injection detection, step-up).
Limitations
A key gap for external validation is the lack of publicly available absolute volumes of verification attempts and detailed error rates; sample bias is also possible due to the specifics of the customer base (industries, geography) and the fact that “fraud” is defined within the product IDV context.
Recommended use cases
Fraud risk, onboarding/KYC, trust & safety, and compliance functions in digital businesses; especially where IDV is a value entry point (marketplaces, fintech, payments, gaming).
Practical data-driven recommendations
- Identify “impersonation” as the dominant type (85%+) in your incident taxonomy and create a separate KPI framework for it: FRR (fraud-rejection rate), FPR (false positives), and response time.
- If you have an e-commerce/marketplace, treat 19.2% as a “red flag” and test multi-layered controls specifically in high-risk flows (seller onboarding, payout, high-velocity SKUs), not just at the entry point.
- Investment plan for 2026: shift focus from “document-based verification” toward AI-powered media, injection/emulator, and behavioral signals—this directly aligns with the trend of a 13% decline in document fraud amid the growth of digital vectors.
Sift Digital Trust Index
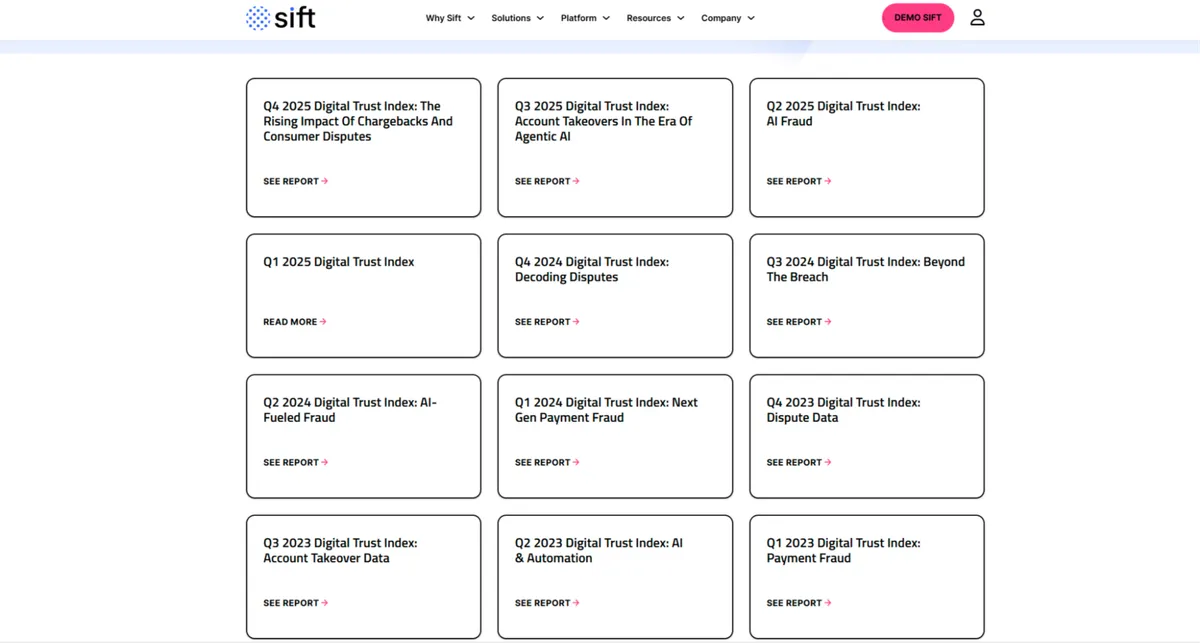
Publication year(s) within the 2024–2026 window. The series of reports (index reports) includes at least materials published in 2025 with data for 2024 (e.g., Q1 2025 on payment fraud).
Coverage
A combination of the “Sift Global Network” (actual attack benchmarks) and consumer surveys (the Q1 2025 report uses a U.S. survey).
Data sources and “samples”
- Platform metrics: Q1 2025 explicitly states that payment fraud attack rates across the Sift Global Network in 2024 remained high at 3.3%.
- Consumer survey: Researchscape International surveyed 1,075 adults (18+) in the U.S. (online, January–February 2025).
- Additional public layer: FIBR (Fraud Industry Benchmarking Resource) aggregates data from the Sift Global Network and states that the metrics on the page are derived from a network of one trillion events per year (1T annual events).
Methodology (metrics and definitions)
Sift provides a definition that is important for analysts: the payment fraud attack rate in FIBR is “the percentage of orders blocked due to fraud out of total transactions.” There is also a manual review rate (the proportion of transactions reviewed by teams), and similar definitions for ATO (the proportion of blocked/pending/failed logins) and chargeback metrics.
Key findings and statistics
- According to Q1 2025 data: the average payment fraud attack rate in 2024 was 3.3%.
- High-risk “points”: ticketing/reservations — fraud attack rate 7.4% and +85% YoY.
- Consumer perspective: 44% of Sift respondents said they had been victims of payment fraud in their lifetime; 34% had seen offers to “participate” in online payment fraud (up from 18% the previous year), 23% either participated or know someone who did.
Regional trends
In Q1 2025, there is more focus on industries/payment types; whereas FIBR allows you to filter benchmarks by geography (US/Canada, Europe, Asia & Pacific, etc.), which is useful for establishing “your own” thresholds.
Strengths
Sift is particularly strong where operational benchmarks are needed (“What is a normal attack rate for my industry?”) and a clear definition of a metric that can be replicated internally. The availability of FIBR as an open-source tool with a large event database makes it convenient for “quick checks” of hypotheses.
Limitations
The data reflects Sift’s network/clients and their blocking/flagging rules; this is not a “universal truth” for all businesses. Some materials (“full report”) may be gated.
Recommended use cases
Fraud ops in commerce/marketplaces/travel/ticketing, product teams focused on payments, as well as analysts building internal “benchmarking” and looking to validate model thresholds.
Practical data-driven recommendations
- Compare your internal “blocked due to fraud” metric with Sift’s definitional baseline (attack rate) and verify that you’re calculating it the same way; without this, the benchmark is not transferable.
- If you’re in ticketing/reservations or a related field, use a +85% YoY increase as a signal to set up a dedicated “war room” for high-demand events (rate limiting, bot defense, step-up verification).
- Use consumer data (34% have seen fraudulent “offers”) as a basis for investing in content moderation/external monitoring (Telegram/social media) and link this to your efforts against card testing/ATO.
TransUnion Global Fraud Trends
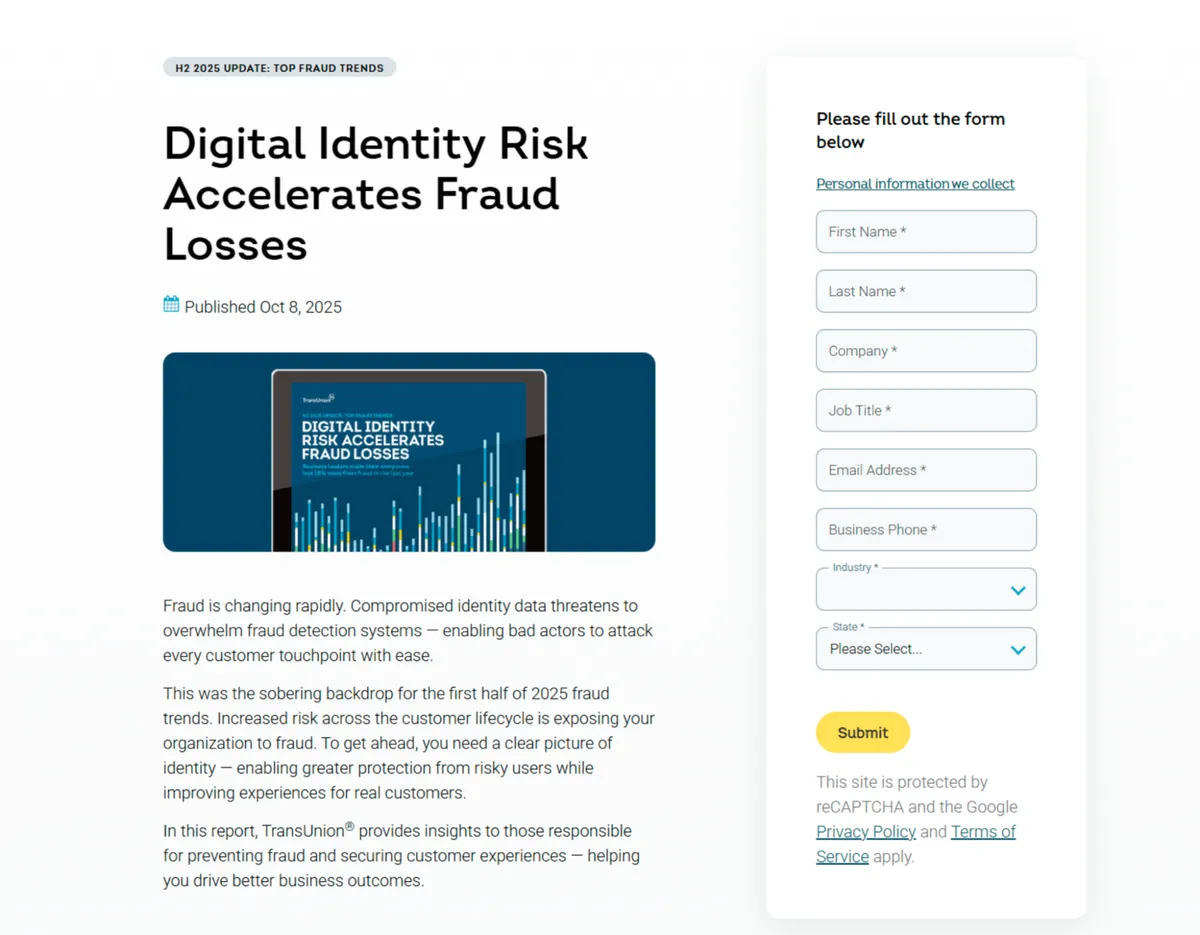
Publication year(s) in the 2024–2026 window. A global report/update for 2025 is available, which clearly outlines the “key takeaways” and methodology and is relevant for planning for 2026.
Coverage
A combination of a global overview plus regional sections (including Africa); business surveys in individual countries and consumer surveys in 18 countries/regions.
Data sources and “samples”
TransUnion explicitly describes three layers:
- Proprietary global intelligence network;
- Business survey: 1,200 business leaders (200 respondents in each of the countries listed in the methodology), fieldwork dates May 29–June 6, 2025, fieldwork partner was Dynata;
- Consumer survey: 18 countries/regions with detailed data per country (the largest being the U.S. with 2,998), fieldwork dates May 5–25, 2025, also with Dynata.
The scale of the transactional layer is highlighted separately: intelligence from “billions of transactions” across over 40,000 websites and apps.
Methodology (metrics, definitions, detection)
The most valuable aspect is the formal definition of suspected digital fraud attempts: these are attempts that TransUnion clients have classified into one of four states (denied in real time due to fraud indicators; denied in real time due to corporate policy violations; fraudulent after investigation; corporate policy violation after investigation) regarding all assessed transactions. It is also explained that country/regional analyses are tied to the location of the consumer or suspected fraudster at the time of the transaction.
Key findings and statistics
- Cost of fraud to businesses: in a sample of business leaders, the average loss is 7.7% of annual revenue; the report also lists this as $534B among respondents.
- “Early stage” as the main risk: account creation in H1 2025 is the riskiest stage, with 8.3% of account creation attempts being suspicious.
- ATO trends: +21% in account takeover volume from H1 2024 to H1 2025 and +141% from H1 2021 to H1 2025.
- Additionally, the report shows trends in the “rate of suspected digital fraud globally” over time, as well as a breakdown of digital fraud types (scammer/solicitation as the most common type in H1 2025, etc.).
Regional Trends
The Africa section shows that suspicious digital transactions by country may be lower than the global average but are “front-loaded” in the lifecycle (account creation being the riskiest stage in most of the countries analyzed), and also provides examples of “hot spots” by industry and country.
Strengths
This is one of the best reports for analysts because it combines:
- Clear definition of digital fraud;
- Transactional scale (40k+ websites/apps);
- Breakdowns by customer lifecycle stages;
- Business and consumer surveys with data and fieldwork dates.
Limitations
“Suspected digital fraud” includes policy violations; this is useful for risk assessments, but caution is needed when comparing it to other reports (where fraud = confirmed fraud). Additionally, comparison regions are tied to the location at the time of the transaction, which is not the same as the “origin” of the attack.
Recommended use cases
Fraud strategy, risk analytics, product/payments, as well as executives who need a well-reasoned business case for investing in end-to-end fraud prevention (especially at the account creation stage).
Practical data-driven recommendations
- Shift your focus to account creation: if the external benchmark is 8.3%—and you are significantly lower or higher—check your tools (bots, velocity, identity resolution) and the quality of detection/labeling.
- Align your internal definition of “suspected fraud” with TransUnion’s 4-tier scheme—this helps make your statistics comparable and manageable.
- For 2026, use the “7.7% of revenue” business survey signal as a top-level KPI range for management, but break it down into manageable drivers (ATO, scam/authorized fraud, synthetic).
Experian Fraud Index
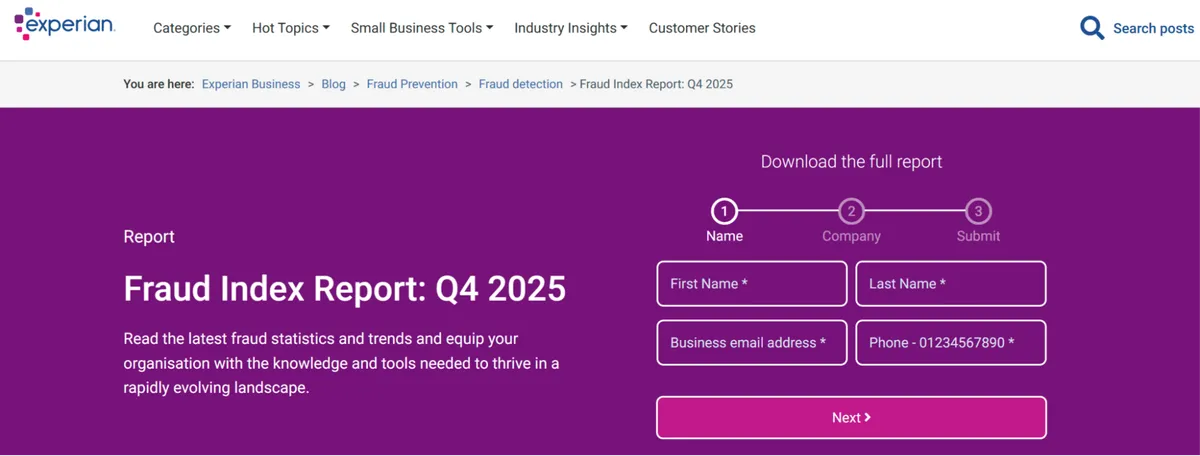
Publication year(s) in the 2024–2026 window. Quarterly reports for 2025 are publicly available (e.g., Q2 and Q3 as PDFs; Q4 on a form page). They contain time series that include comparisons with 2024.
Coverage
This is primarily a tool for the UK market (Experian UK), broken down by financial product groups: current accounts, mortgages, cards, asset finance, loans, savings accounts, etc.
Data sources and “sample”
The report is based on application data and defines fraud as confirmed/ detected/prevented fraud applications. Absolute application volumes are not provided in the publicly available PDFs; the index is normalized “per 10,000 applications received,” which makes the metric comparable over time even when baseline volumes change.
Methodology (index metrics, categories)
Key definition: Fraud Index = number of confirmed/detected/prevented fraud applications per 10,000 applications received. The report further breaks down fraud into confirmed vs. suspected and into categories (for example, in mortgages—misrepresentation/ false documents/ID theft, etc.).
Key findings and statistics
- Q2 2025: current accounts showed a sharp increase (+26 points vs. Q1) , while card fraud rates fell by 18 points; the text also mentions a “record-high confirmed fraud rate” for current accounts at the start of the quarter (2.07%), which normalized to 1.47% by the end.
- Q3 2025: the index declined in 5 out of 6 product groups (the largest drop was in current accounts), while loans rose slightly; for mortgages, it is noted that first-party fraud remains dominant (~86%), with third-party fraud at 14%; it is also noted that in mortgages, first-party fraud reached 33% (the highest level in 12 months) amid a rise in application volume.
- Q4 2025 (overview page): The index is again down in 5 out of 6 product groups, most notably savings accounts; mortgages are the only group showing slight growth.
Regional trends
Since this is a UK index, “regionality” here is more product-segment-based than geographic. It is a strong local benchmark for UK solutions but does not translate well to global markets without additional sources.
Strengths
Maximally clear normalization (to 10,000) and product-level granularity make this report a good “radar” for application fraud and first-party misuse (especially when application volumes are growing, and confirmed fraud may “appear” stable without normalization).
Limitations
Limited geographic coverage (primarily the UK), lack of absolute volumes in publicly available data, and, consequently, the inability to assess statistical error. Also, when comparing with other “digital fraud” reports, it is important to remember that this specifically covers application fraud, not a transactional attack rate or IDV fraud.
Recommended use cases
UK financial organizations, lenders, banks, and risk teams that manage application pipelines (onboarding/credit) and want an “early warning” on products and fraud types.
Practical data-driven recommendations
- Establish an internal KPI of “fraud per 10,000 applications” at the product level to ensure direct alignment with the index approach (and avoid getting lost in “ raw” volumes).
- If you see “spikes at the start of the quarter” (as in the example of current accounts Q2 2025), implement anomaly detection (weekly control chart) and look for correlations with changes in campaigns/channels/partners.
- Manage first-party friction separately: when first-party fraud increases, classic third-party controls may not work; behavioral signals, monitoring for “misuse of product,” and policies aligned with revenue/collections are required.
Guide to Choosing a Report by Role and Budget
Start with one question: Do you need a benchmark “about scam trends,” “about people,” “about countries,” “about transactions,” “about KYC,” or “about applications”? Next, narrow down the options and combine two sources that “don’t overlap:”
- If you are defining a geographic strategy or policy level: Sumsub as country scoring + TransUnion as a transactional baseline.
- If you manage onboarding/KYC/IDV: Veriff as attack typology + TransUnion as a lifecycle benchmark (account creation) + Sumsub as country-specific factors.
- If you manage payments/commerce: Sift (attack rates and payment types) + TransUnion (ATO/scams + identification of suspected digital fraud).
- If you have a strong UK component in your application pipelines: Experian UK Fraud Index as a “signal dashboard” + one global report (TransUnion) for external context.
All six sources have a “free” entry threshold, but with varying levels of availability.
Conclusion
So, one of the best global fraud index reports you must use is Civoryx Scam Trend. Based on all these reports, here are the 5 most effective steps for 2026:
- Move security “left” — to account creation. External data shows that account creation may be the riskiest stage, and ATO continues to grow; security focused solely on payments is lagging behind.
- Prepare for “impersonation as the default ” and AI-enhanced media. At Veriff, impersonation is the dominant type of fraud, and AI/altered media is growing exponentially; this means investing in liveness, device/injection defense, and context verification, not just documents.
- Calibrate fraud metrics through definitions. “Suspected digital fraud” (TransUnion), “blocked payment fraud attack rate” (Sift), and “fraud applications per 10k” (Experian) are different metrics. Without aligning definitions, you’ll end up with incorrect benchmarks and flawed investment decisions.
- Use country indices as risk factors, not as a “verdict.” Sumsub clearly shows that “geography ≠ fate” and provides a structure of causes (pillars) and data slices. The strongest approach is to incorporate the pillars as features and validate them using your own loss data.
- Add an early “radar”, but monitor the signal quality. Civoryx can serve as such a radar if you’re on a tight budget, but due to potential consistency issues, it should be used only as a “guide for what to check” rather than as the basis for models.
We hope our article was helpful to you.